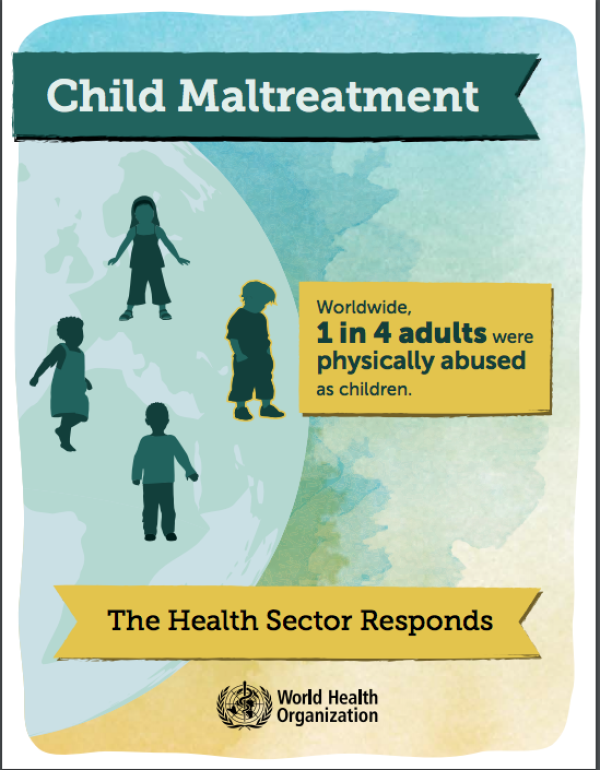
The World Health Organisation (WHO) has released a new infographic brochure on the health sector’s role in prevention and response to child maltreatment. Defined as the abuse and neglect of children, child maltreatment takes many forms: physical, sexual or psychological abuse and even neglect. The brochure demonstrates the extent to which child maltreatment is spread around the world and also show the consequences of child maltreatment. It ends with giving suggestions on the ways which child maltreatment can be prevented.

You might like..
0
190
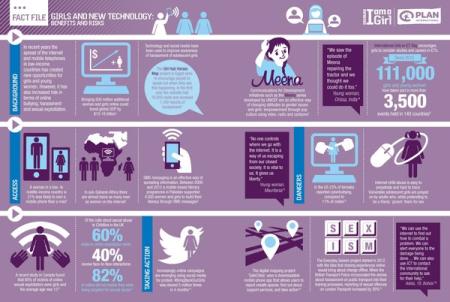
Plan International has created and published an infogrphic that details the the benefits and risks of new technology to girls around the world. The inforgraphic contains facts and figures regarding the use of technology by girls, how they use it and…
0
26
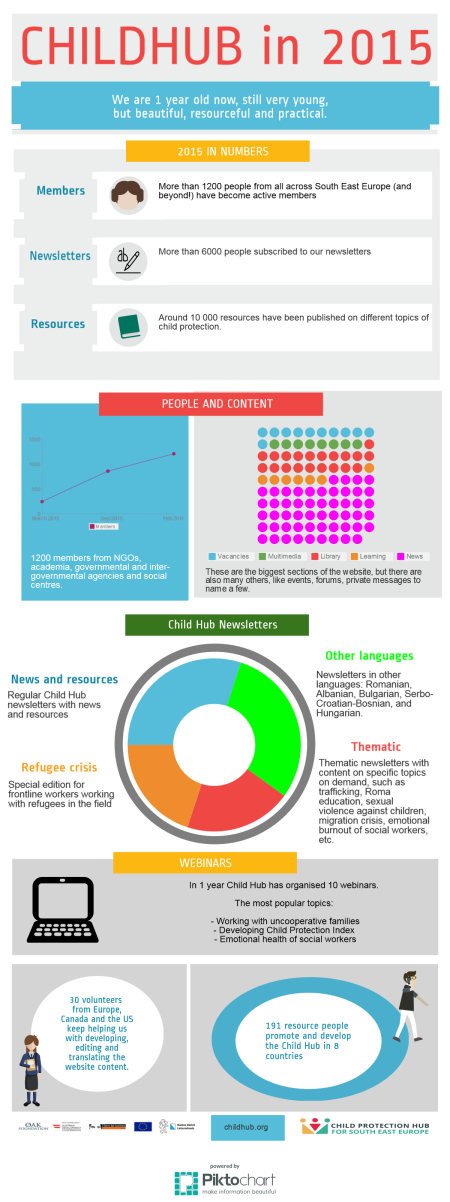
This infographic tells about the work of the Child Protection Hub in 2015. It summarizes all the input from the Hub members and supporters and covers major numbers, people and content in a visual way.
0
1855
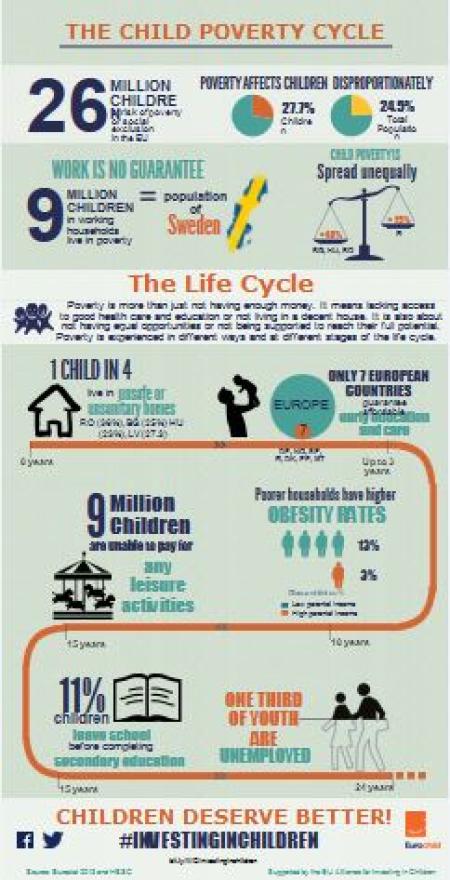
The infographics of Eurochild provides insights into child poverty in Europe.
yes
0
1248
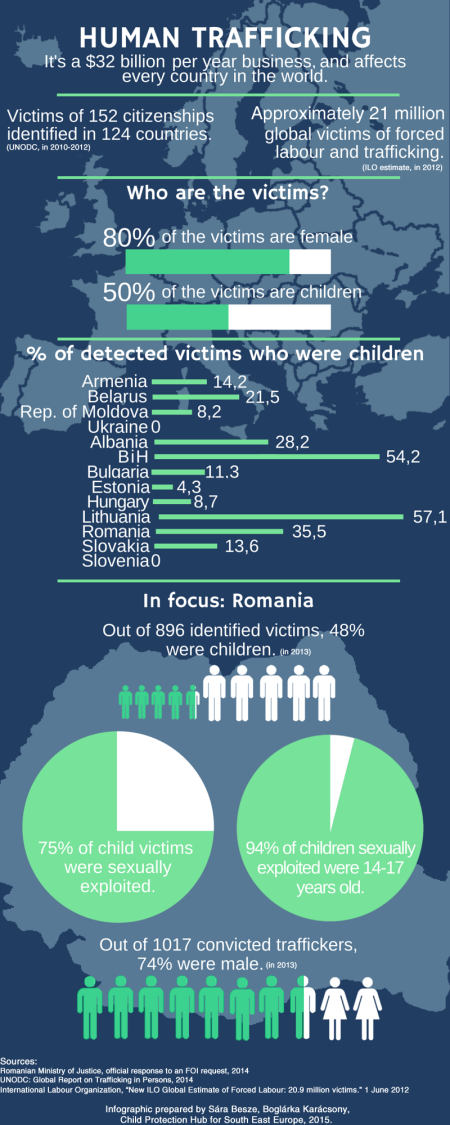
This infographic presents key facts and figures on child trafficking, starting with global estimates, moving into information on the Central and Eastern Europe region, and finally providing a close-up look at data on child trafficking in…
0
408
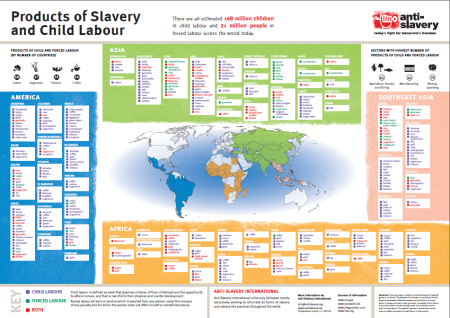
Anti-Slavery International has produced an infographic highlighting the scale of forced labor including forced child labor in Asia, South-East Asia, America and Africa. An estimated 168 million children are in labor today with around 21 million…
0
35
As part of the "Legal Aid Advisory" project, whose implementation is funded by the Ministry of Justice in Croatia, a "Brochure on the rights of persons who survived or are experiencing violence" has been created.
This brochure has been…
0
44
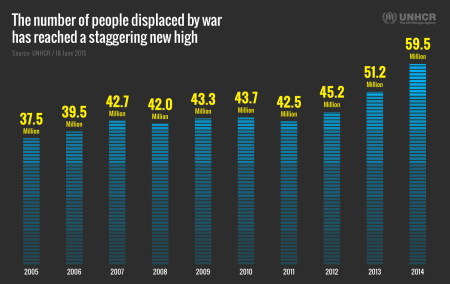
Whether it be civil, guerilla or other forms of warfare, its increase reflects the influx of people displaced by war. While 37.5 million were displaced in 2005, the amount has nearly doubled, with a total of 59.5…
0
432
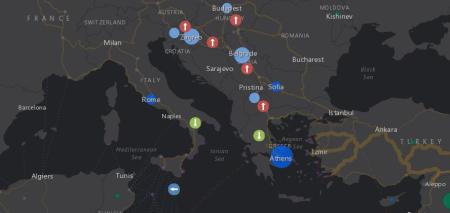
IOM has created an interactive map showing most recent trends, based on ESRI statistics.
Since January 2016, 84,406 migrants, including asylum seekers are reported to have arrived to Europe by land and sea routes. Tragically 410 migrants are known…
yes
0
31
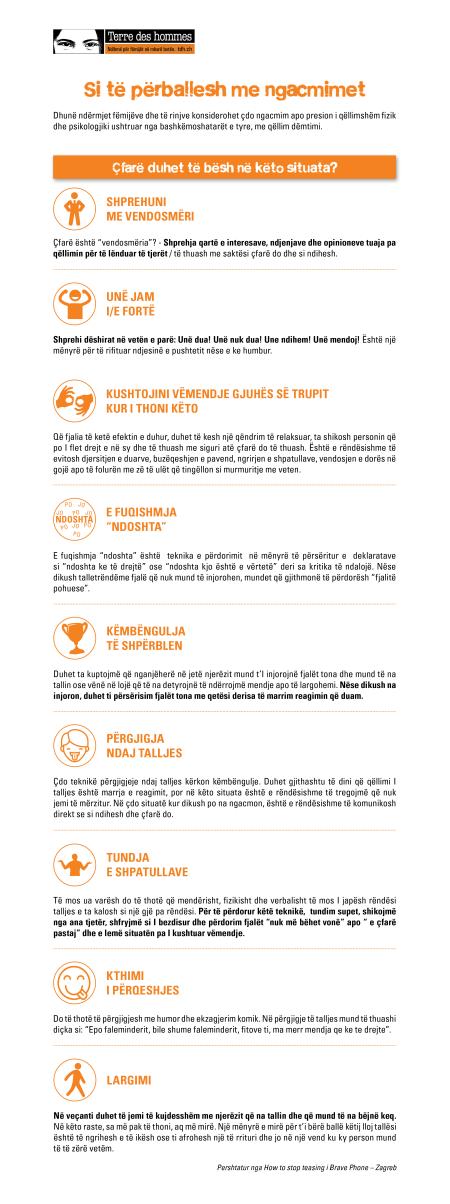
This infograph was based on the child-friendly material produced by Brave Phone centre Zagreb, with the same name. It is a powerful self help tool as well as a good instrument for children/teens caregivers to support them when faced witht the…
0
2
'Barnabos' illustrates the high cost of education in Ireland through this infographic. The government's under-investment in schools leads to heavy reliance on 'voluntary contributions' from parents. Items parents may pay for…
0
166
This MindTools infographic on burnout prevention illustrates the most common symptioms of burnout and the coping strategies to reduce stress and improve your well-being at work.
0
86
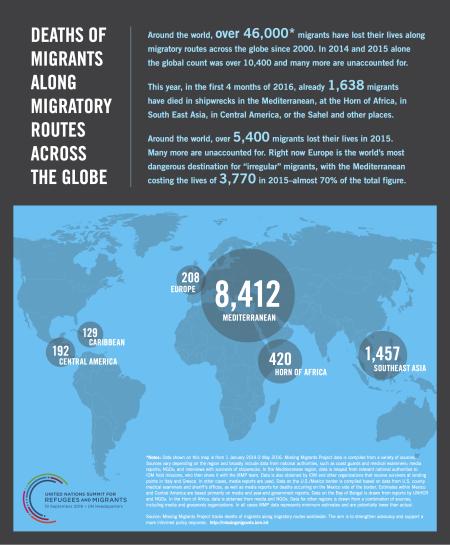
The United Nations has compiled some infographics based on official data sources on migrants and refugees worldwide.
According to the data, the number of refugees and migrants has significantly increased in the past 15 years, along with the…
yes
0
6
This infographic presents the major results of Child Protection Hub work in 2015-2016. You can see below numbers about the network, website analytics, learning opportunities we provided and many more.
0
51
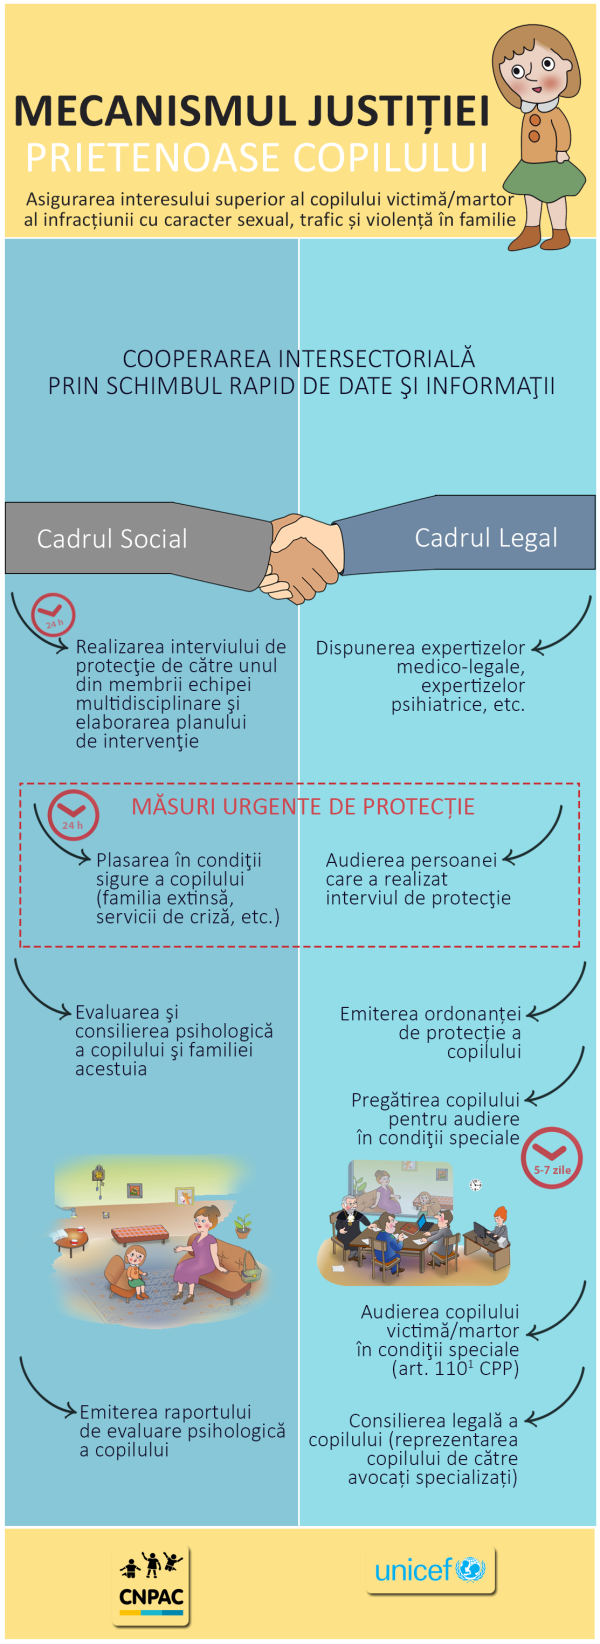
Annually, hundreds of children in Moldova come in direct contact with the justice system, either as those who commit crimes or as victims/witnesses of crime.
In order to ensure the best interests of the child victim/witness of sexual…
0
281
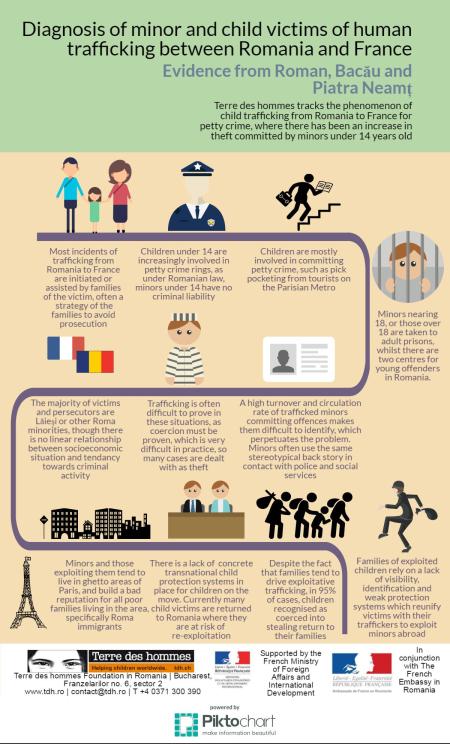
This infographic from Terre des hommes Romania summarises a new report which diagnoses the processes, outcomes and effects of human trafficking of minors from Roman, Bacău and Piatra Neamț to France. The report charts a rise in the number of…

